



When a monthly quality report from a contract manufacturer states "overall yield: 99.2%" and nothing further, it is not a quality report — it is a headline. And a headline is precisely what a struggling production line relies on to remain unexamined.
A single aggregate figure can be entirely accurate and still conceal significant risk. A 99.2% overall yield can coexist with one board revision running at 92%, one component package failing repeatedly, or one shift producing three times the defect rate of the others. Averages absorb outliers by design. A procurement team that accepts only the top-line number is, in effect, allowing its supplier to decide what does not need to be seen.

What should be requested instead is data disaggregated across four dimensions:
By product or part number — so a chronic issue on a single board does not disappear inside a healthy portfolio-wide average.
By defect type — solder opens, tombstoning, misalignment, and functional failures each indicate different root causes and warrant separate reporting.
By time period, weekly rather than monthly — a trend accelerating over four weeks reads very differently from a flat monthly figure.
By process step — SMT placement, reflow, inspection, and manual assembly each contribute differently to overall yield, and combining them obscures where intervention is needed.
A supplier unable to produce this breakdown on request has, in effect, answered the question already. In a properly implemented quality system, this data already exists within MES or SPC records; the only open question is whether the supplier is willing to share it.
Reading the Metrics That Actually Matter
Three metrics are quoted constantly and understood correctly far less often.
DPPM (Defects Per Million Opportunities). The figure is meaningless without knowing its denominator. Some suppliers calculate DPPM against total solder joints or component placements — a rigorous, granular basis. Others calculate it against total boards shipped, which flatters the number considerably on complex, high-density assemblies. The question worth asking directly is: "per million what?" A board with 2,000 placements represents 2,000 opportunities for defect per unit; treating the entire board as a single opportunity renders any resulting DPPM figure of limited value for comparison.
FPY (First Pass Yield) versus shipped yield. FPY reflects the percentage of units that passed inspection and test on the first attempt, without rework. Shipped yield reflects the percentage that eventually shipped, after any rework loops. A supplier may report a 99% shipped yield while FPY sits at 88% — meaning one in eight boards required intervention before becoming sellable. That gap is where cost accumulates unseen: labor, cycle time, and component consumption that never appear in the negotiated unit price.

Rework rate and its distribution. The rate itself is less informative than the reason-code breakdown behind it. Rework concentrated in a single root cause — a specific placement machine, or a specific component lot — is a contained, solvable issue. Rework distributed evenly across many causes suggests a broader process-control problem, and process-control problems tend to recur unpredictably rather than being resolved once and for all.
Seven Signs a Quality Report May Be Overstated
Genuine production data carries natural variation. Manufactured data frequently does not. Indicators worth watching for include:
The same yield figure recurring across three or more consecutive months
Defect counts distributed with suspicious evenness across product lines of markedly different complexity
Rework quantities that fail to reconcile against total units shipped for the period
Round numbers appearing repeatedly (98.0%, 99.0%) in place of the natural variance real processes generate
A report that states yield without ever listing defect categories or root causes
An absence of week-to-week variation within a monthly figure, despite clear fluctuation in volume
Reluctance or delay when raw SPC data behind a summary figure is requested
None of these, in isolation, proves misrepresentation. Two or more occurring together, however, constitute reasonable grounds to request underlying data rather than a summary — and a supplier confident in its own numbers will have no difficulty providing it.
Five Stops on a Site Audit Worth Prioritizing
A facility tour organized around conference rooms and finished-goods displays reveals comparatively little. The walk is better redirected toward five specific stops.
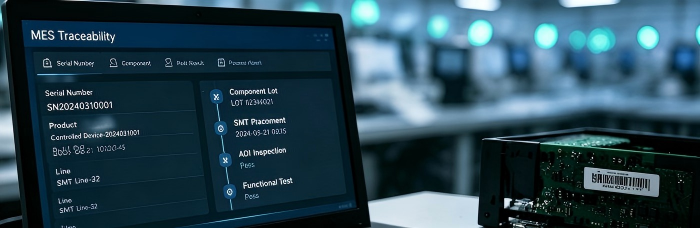
First, the SPI screen at the printer: request live SPC charts, not a static demonstration screen. Second, the AOI defect image archive: determine whether images are retained and searchable, or discarded once a board passes or fails, since retained images are what allow a defect trend to be investigated weeks later. Third, the quarantine or non-conforming material area: assess whether rejected units are physically segregated and logged, or merely set aside informally — the latter being how non-conforming parts quietly re-enter the line. Fourth, an MES traceability query performed live: ask the host to trace a single serial number in real time, from component lot through test result. Fifth, the engineering change order (ECO) execution record: the relevant question is not whether a change was filed, but whether it was implemented and verified on the floor.
Each stop should yield a specific answer rather than a general assurance. A host unable to produce live SPI data or trace an actual serial number on request suggests that the traceability infrastructure underpinning future audits and recalls may exist on paper alone.
Establishing an Ongoing Quality Dialogue
A monthly quality review should follow a fixed agenda: yield trends by product line, leading defect categories with root-cause status, open corrective actions with named owners and dates, and any engineering changes implemented since the previous meeting.
A KPI threshold — a defined DPPM ceiling or FPY floor — should be established in advance to automatically trigger a formal Supplier Corrective Action Request (SCAR). A SCAR should include root-cause analysis, containment actions, permanent corrective actions, and a verification date. Absent a pre-agreed trigger, "we will look into it" can substitute indefinitely for a documented process.
The objective is not to approach every EMS partner with suspicion, but to know which questions distinguish a genuinely transparent quality system from a well-formatted summary. At PCBCart, this level of layered, traceable quality reporting is treated as a baseline expectation rather than an occasional courtesy. To see what a fully layered quality report looks like — broken down by product, defect type, and process step, with live MES traceability behind it — request a sample PCBCart quality report.
Helpful Resources
• How to Evaluate A PCB Manufacturer or A PCB Assembler
• Some Handy Methods in Evaluating SMT Assembler's Capabilities
• How to Implement Quality Inspection of PCBs
• Printed Circuit Board Assembly Inspection Methods
• Why is X-ray Inspection Technology So Important in PCB Assembly?


