



Mixed-technology boards — SMT fields with through-hole connectors, headers, or power components — force a THT assembly decision on every HMLV production run. This reference lays out a static cost comparison framework for evaluating manual hand soldering against automated selective wave soldering, using illustrative monthly volume brackets. It is not a real-time calculator; treat the figures as a starting structure to substitute with your own labor rates, defect data, and volumes.
Static Cost Comparison by Monthly Volume
The ranges below illustrate directional cost behavior across four volume brackets. Labor rate assumed at $25–35/hour loaded cost (illustrative — substitute your regional rate); selective soldering figures assume an already-amortized machine, with fixture and programming cost excluded here and addressed separately below.
50 boards/month: manual THT labor runs roughly $400–700/month, against $150–250/month for selective soldering process cost plus fixture amortization. At this volume, the rework cost delta between the two methods is typically minor.
100 boards/month: manual labor rises to roughly $900–1,400/month, versus $250–400/month for selective soldering plus fixture amortization. The rework cost delta starts to become material at this point.
200 boards/month: manual labor reaches roughly $1,800–2,800/month, against $450–700/month for selective soldering plus fixture amortization. The rework cost delta is significant here.
500 boards/month: manual labor climbs to roughly $4,500–7,000/month, versus $900–1,400/month for selective soldering plus fixture amortization. At this volume, the rework cost delta dominates the overall comparison.
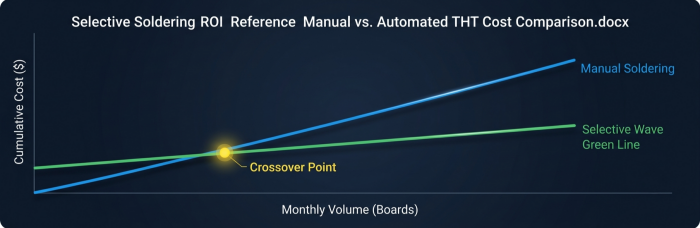
These ranges scale roughly linearly for manual labor (cost tracks board count directly) but sub-linearly for selective soldering once fixture and programming costs are absorbed across a run — the core mechanic behind the crossover point discussed next.
Cost Structure Comparison: Three THT Soldering Methods
Manual Hand Soldering
Cost driver: direct labor, scales linearly with unit count and joint count per board.
Fixed cost: near zero (no fixture, no programming).
Variable cost: highest per-unit cost of the three methods; operator skill variance affects consistency.
Selective Wave Soldering (e.g., N2-protected selective wave equipment such as ZSWHPS-11-2)
Cost driver: amortized fixture (synthetic stone fixtures for warpage-sensitive boards) and programming time, spread across the production run.
Fixed cost: moderate — fixture design/build and nozzle programming per board revision.
Variable cost: low per-unit; nitrogen atmosphere reduces dross and touch-up but adds a modest per-cycle consumable cost.
Full (Conventional) Wave Soldering
Cost driver: highest fixed cost sensitivity — requires wave-solder-compatible pallet/mask tooling to protect adjacent SMT fields.
Fixed cost: highest of the three when SMT-THT mixed boards require masking.
Variable cost: lowest per-unit at high volume, but least suited to HMLV mixed-technology work due to masking overhead per board revision.
Cost Curve Crossover Analysis
Plotting cumulative cost against monthly volume, the crossover between manual and selective soldering typically falls in the range where fixture amortization per unit drops below the labor cost differential — commonly somewhere in the 60–120 boards/month range for a moderate-complexity board, though this shifts significantly with joint count, connector height variance, and rework severity. Below this range, manual soldering's zero fixed cost often wins on pure hard-dollar terms. Above it, the labor cost delta compounds faster than the amortized fixture cost, and selective soldering pulls ahead — before accounting for defect-driven rework, which shifts the crossover earlier.
Defect Rate and Rework Cost: A Quantified Illustration
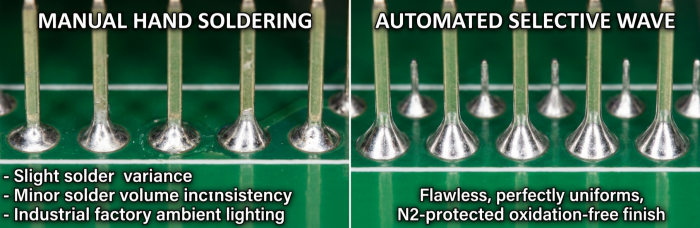
Industry-cited ranges for manual THT hand soldering defect rates commonly fall in the 2–4% range for mixed-technology boards with tight pitch or shadowing risk (heat-sensitive components, dense connector fields). Automated selective soldering with closed-loop process control (SPI-informed dispense/print parameters, N2 atmosphere) is commonly cited in the 0.2–0.5% range for comparable joint complexity.
Illustrative example (not a PCBCart production figure): on a 150-board/month run with 40 THT joints per board:
Manual, 3% defect rate → ~4.5 boards/month with at least one THT defect requiring rework touch-up.
Selective soldering, 0.35% defect rate → well under 1 board/month.
At a loaded rework cost of $15–25 per touch-up event (diagnosis, resolder, re-inspection — illustrative, substitute your own), the monthly rework cost delta alone can approach or exceed the labor cost delta, which is why rework should always be modeled alongside direct labor rather than treated as a rounding error.
Equipment Investment vs. Outsourcing: A Decision Framework
Rather than prescribing a threshold, use this logic sequence against your own numbers:
Estimate your break-even volume. Divide your selective soldering equipment's amortized monthly cost (purchase price ÷ expected useful life in months, plus maintenance) by your per-unit labor savings (manual cost/unit minus selective cost/unit). The result is the monthly volume at which in-house automation pays for itself.
Compare against your actual monthly THT volume, including all board types that could share the same fixture platform. Single-board-type volume is often too low; multi-program utilization is what makes in-house automation viable for HMLV shops.
Factor in defect-driven cost, not just labor. A board with high THT joint density or shadowing risk pushes the outsourcing/automation case forward even at lower unit volumes, since rework cost scales faster than unit count.
Weigh fixture reusability. Warpage-prone or connector-dense boards that require synthetic stone fixturing carry a real setup cost per new board revision — factor this into your break-even math rather than assuming a single fixture cost applies indefinitely.
If your break-even volume exceeds your realistic monthly THT demand across all applicable board types, outsourcing to a provider with selective soldering already amortized across many customers' volume is usually the more defensible position on cost grounds alone.
Worked Example: Industrial PLC Board, 150 Units/Month
Board profile: industrial automation PLC I/O board, 35 THT joints (terminal blocks, connectors, one through-hole relay), moderate warpage risk.
Step 1 — Manual labor cost. Assume 4.5 minutes/board THT hand-soldering time at a $30/hour loaded rate: 150 boards × 4.5 min = 675 min = 11.25 hours × $30 = $337.50/month direct labor.
Step 2 — Manual rework cost. At 3% defect rate: 150 × 0.03 = 4.5 boards/month needing rework at $20/event = $90/month.
Step 3 — Manual total: $337.50 + $90 = $427.50/month.
Step 4 — Selective soldering process cost. Assume 1.2 minutes/board cycle time (programmed, unattended run) at the same $30/hour rate: 150 × 1.2 min = 180 min = 3 hours × $30 = $90/month, plus fixture amortization — for this illustration, assume a $600 fixture amortized over 12 months = $50/month.
Step 5 — Selective rework cost. At 0.35% defect rate: 150 × 0.0035 ≈ 0.5 boards/month at $20 = $10/month.
Step 6 — Selective total: $90 + $50 + $10 = $150/month.
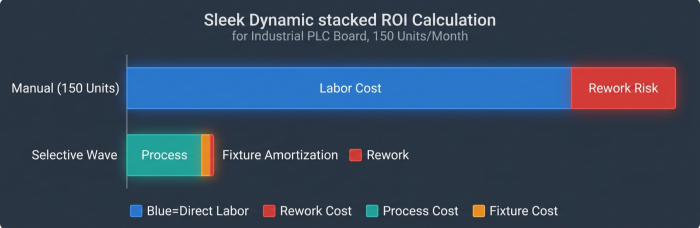
Net illustrative monthly delta: ~$277.50 in favor of selective soldering at this volume and defect profile — before any consideration of consistency, traceability, or operator training overhead, all of which typically favor the automated path further at this joint density.
Build Your Own Comparison
The ranges and worked example above are meant to be replaced with your own labor rates, joint counts, and observed defect data — not used as quoted figures. A downloadable Excel version of this comparison framework, with the formulas exposed so you can substitute your own inputs directly, is available for readers who want to run this against their own board mix.
For boards with THT joint density, shadowing risk, or warpage sensitivity that make this calculation non-trivial, PCBCart's manufacturing engineering team can review your mixed-technology board file and provide a selective soldering process assessment specific to your design — submit your board files to start that evaluation.
Ressources utiles
• Free PCB DFM Check for Assembly Projects
• How to Order PCB Assembly Online
• Printed Circuit Boards Assembly (PCBA) Process Overview
• PCB Assembly Services Overview


